Category: Projects

I have various projects that are on-going. Here is a list of those I have published.

  • Cabrillo Map Visualizer

    Cabrillo Map Visualizer

    During my break in the 2025 CQWW SSB contest, someone on Discord said:

    “After this contest I’ll ask ChatGPT to make me a map of all the activations.”

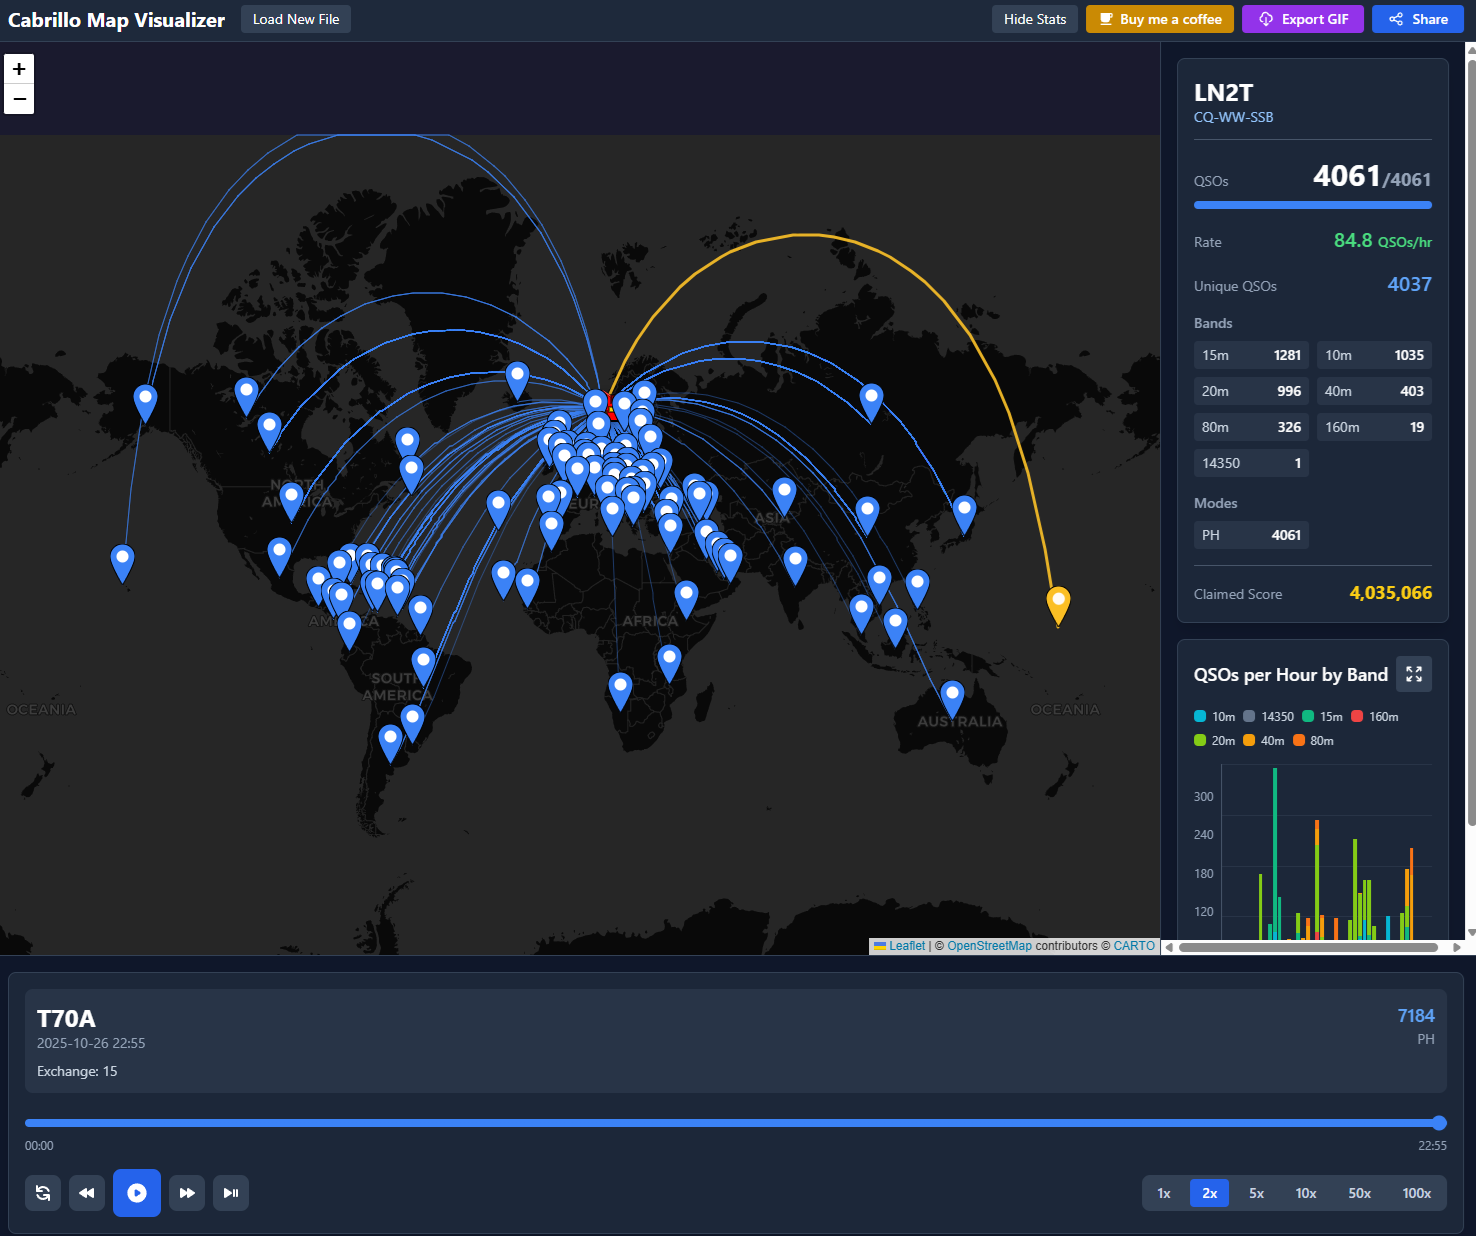
    I thought that was a really cool idea, so I built an app that does exactly that.

    Enter Cabrillo Map Visualizer!

    It’s a small web app that runs entirely in your browser, meaning no data ever leaves your computer. I believe in privacy, and since this could be done completely client-side, why not? (Plus, it saves me a bit on hosting costs)

    You simply export your contest log (for example, from N1MM) as a Cabrillo file, drop it into the app, and generate a map with an animated timeline of your QSOs.
    Since you already have to produce this log to submit your contest entries anyway, this is meant as a fun little tool to visualize all your contacts after the event.

    You can also share your map with others while all the data is encoded directly in the URL, so again, no data is sent anywhere. And if you’d like, you can generate a GIF of the timeline as well.

    Note on GIF generation:
    Even though I spent quite some time trying to make the GIF rendering work flawlessly, I was unable to fully decouple the rendering from the browser resolution. The GIF will therefore use the current aspect ratio and zoom level, so you might need to play around a bit to get it just right.

    Technical bits (for the curious)

    The app is built using React and runs as a fully static site hosted on Cloudflare Pages, which makes it quite fast and serverless by design.

    Under the hood you will find:

    • React Leaflet and Leaflet Geodesic for rendering the map and and connection geodisics
    • LZ-String for URL compression when sharing the maps
    • html2canvas and gif.js to capture and animate the timeline into GIF format
    • date-fns for handling timestamps and animation timing
    • Along with Vite to build everything

    You can try it here: https://cabrillo-map.lb1dk.no/
  • New tool aimed at POTA and SOTA hunters

    Currently the app is not working! I am looking at fixing the data import!

    Being unwell for a bit gave me time to indulge in some POTA and SOTA hunting. While the existing tools are solid, I’ve always thought it would be much better to visualize activations on a map instead of just working from a list. So, I decided to build an app to do just that: SpotMap.

    How SpotMap Came to Be

    The project started with me experimenting with the new agent feature in Replit AI, which made setting up the app quick and fun. It’s amazing to let AI do the heavy lifting. However, the cost of the AI agent ($25/month) combined with Replit’s hosting plans (even the cheapest ones) was too steep for a basic project. Hosting the app there would have set me back over $15/month.

    Since I already subscribe to Cursor AI and have been using its tools for a while, I decided to migrate the project there and continue development. The system is built with a Node.js backend and a React frontend, for those interested in the tech details. I also managed to host it for free on Render.com, which is a big plus. I love finding free hosting solutions—for example, this blog is was hosted for free on Cloudflare Pages, so it doesn’t didn’t cost me a thing (Note from the future: I have since moved my blog over to a WordPress site so my hosting is no longer free).

    Who Is SpotMap For?

    SpotMap is designed for POTA Hunters and SOTA Chasers who want a better way to track activations. It’s intuitive to use, but here are some features you might not immediately notice:

    Filtering Options: Easily filter activations by POTA or SOTA, as well as by band and mode.

    Pinning Spots: You can pin a spot to keep it at the top of your list, whether you’re working from the map or the recent spots list.

    QSO Logging: Log your QSOs by clicking the icon next to the pin button. Later, you can export your logs as ADI files to import into other software. All data is stored locally in your browser, so only you can see your QSO notes.

    Color-Coding: The colors on the map represent different types of information. Check the legend (click the info icon in the bottom left corner of the map) for details.

    Support the Project: If you find SpotMap useful, consider clicking the “Buy me a coffee” button to support its development!

    Final Thoughts

    I built SpotMap to enhance the experience of POTA and SOTA hunting, and I hope it becomes a useful tool for you. You can find a link to the tool on the top menu of this blog and if you have any issues or feature ideas, feel free to drop me an email at contact@lb1dk.no

    Happy hunting!