During my break in the 2025 CQWW SSB contest, someone on Discord said:
“After this contest I’ll ask ChatGPT to make me a map of all the activations.”
I thought that was a really cool idea, so I built an app that does exactly that.
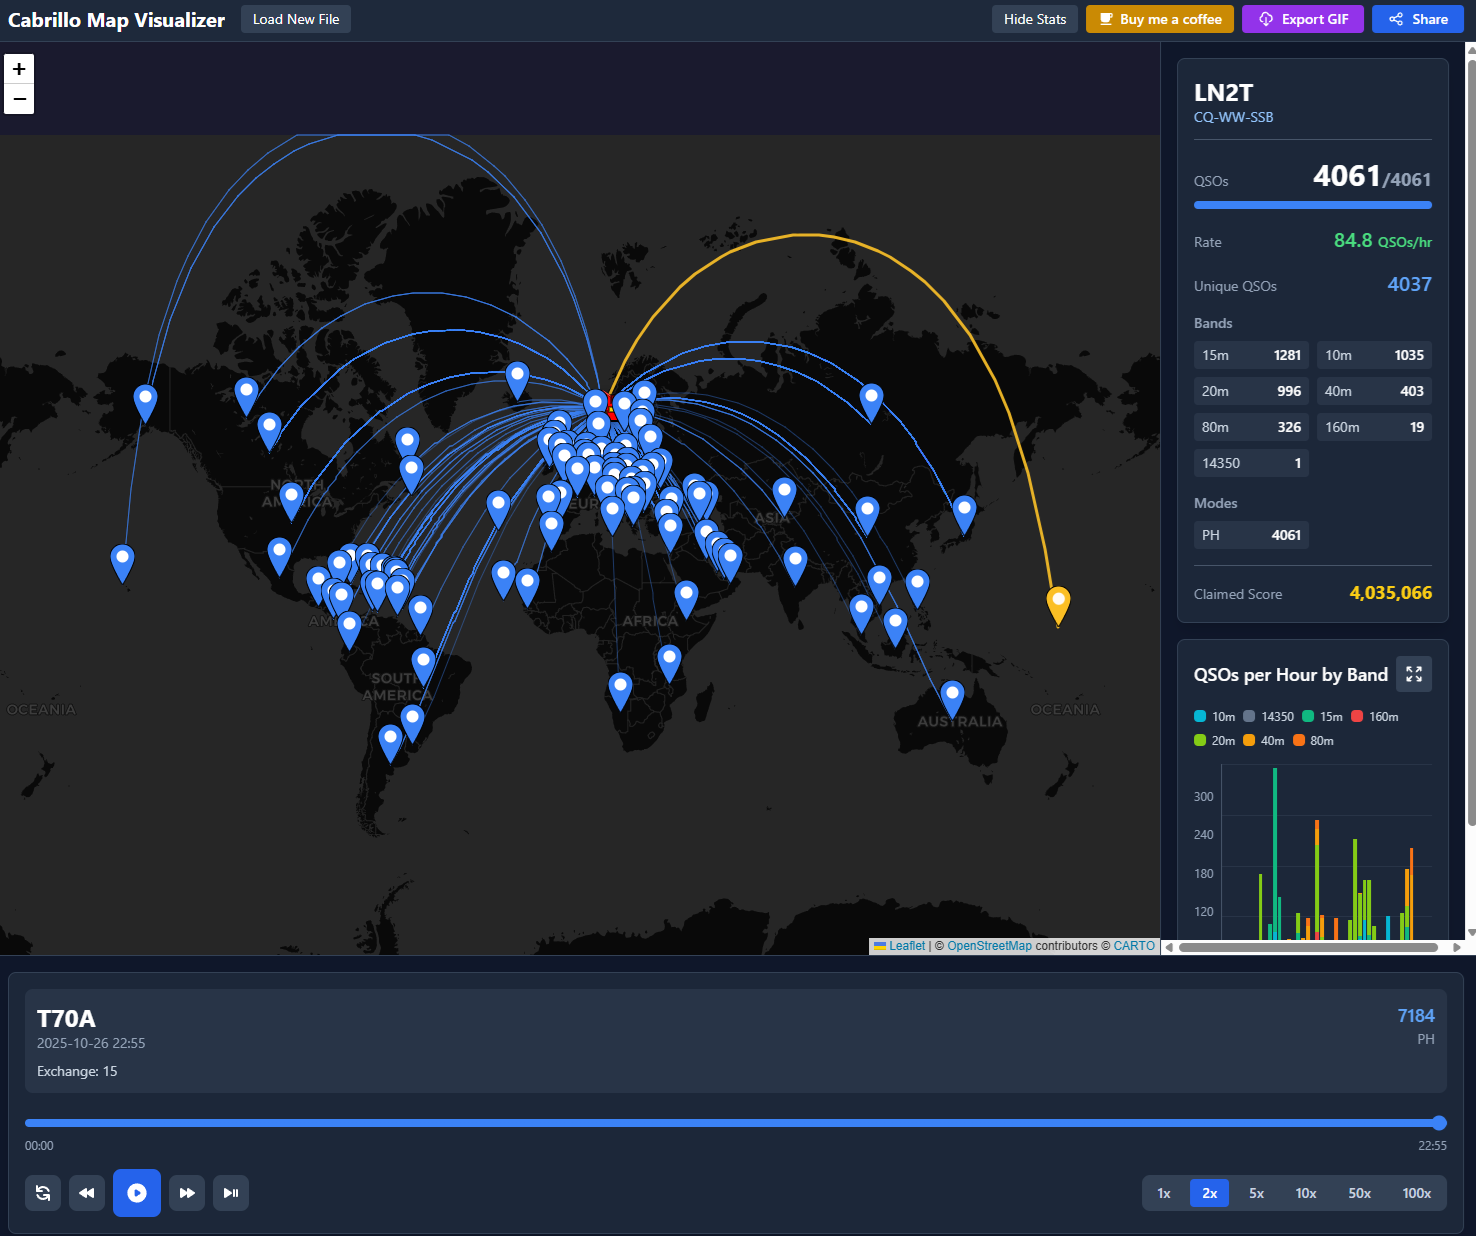
Enter Cabrillo Map Visualizer!
It’s a small web app that runs entirely in your browser, meaning no data ever leaves your computer. I believe in privacy, and since this could be done completely client-side, why not? (Plus, it saves me a bit on hosting costs)
You simply export your contest log (for example, from N1MM) as a Cabrillo file, drop it into the app, and generate a map with an animated timeline of your QSOs.
Since you already have to produce this log to submit your contest entries anyway, this is meant as a fun little tool to visualize all your contacts after the event.
You can also share your map with others while all the data is encoded directly in the URL, so again, no data is sent anywhere. And if you’d like, you can generate a GIF of the timeline as well.
Note on GIF generation:
Even though I spent quite some time trying to make the GIF rendering work flawlessly, I was unable to fully decouple the rendering from the browser resolution. The GIF will therefore use the current aspect ratio and zoom level, so you might need to play around a bit to get it just right.
Technical bits (for the curious)
The app is built using React and runs as a fully static site hosted on Cloudflare Pages, which makes it quite fast and serverless by design.
Under the hood you will find:
- React Leaflet and Leaflet Geodesic for rendering the map and and connection geodisics
- LZ-String for URL compression when sharing the maps
- html2canvas and gif.js to capture and animate the timeline into GIF format
- date-fns for handling timestamps and animation timing
- Along with Vite to build everything
You can try it here: https://cabrillo-map.lb1dk.no/